Now that we finished our animal research and slideshows, let look at all the animals we studied and create a graph about how each animal is classified. We will use The Graph Club for this project.
Tag Archives: graphing
Favorite Fruits Graph
You have collected data on the class’ favorite fruits, and today you will use The Graph Club to graph the results of the survey. Add two interpretations of the graph in the notes section of the graph.
Graphing Food Drive Results
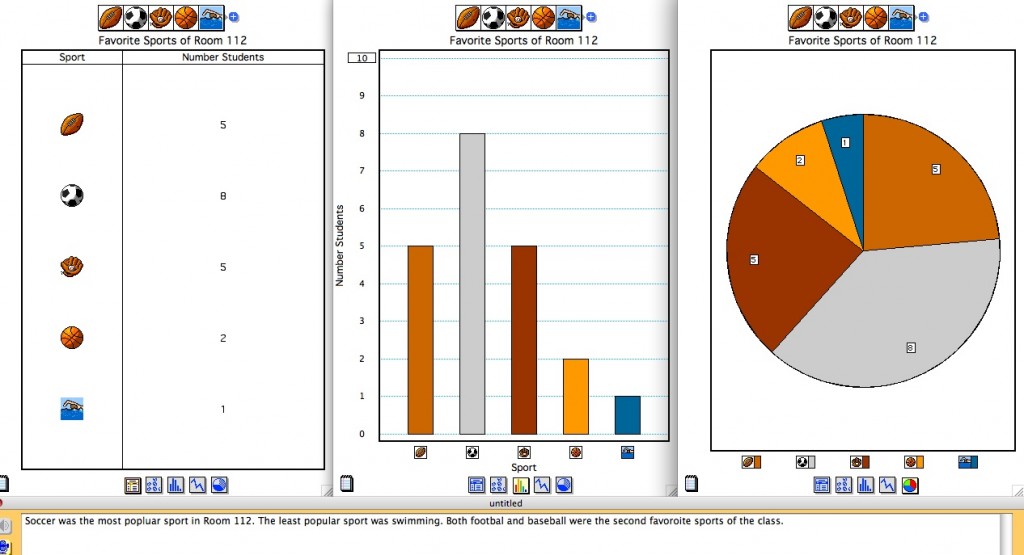
Favorite Sports Graph
Today we will use The Graph Club to create a table, bar, and circle graph of the favorite sports data that you collected in class. Be sure to add three interpretations of the graph.
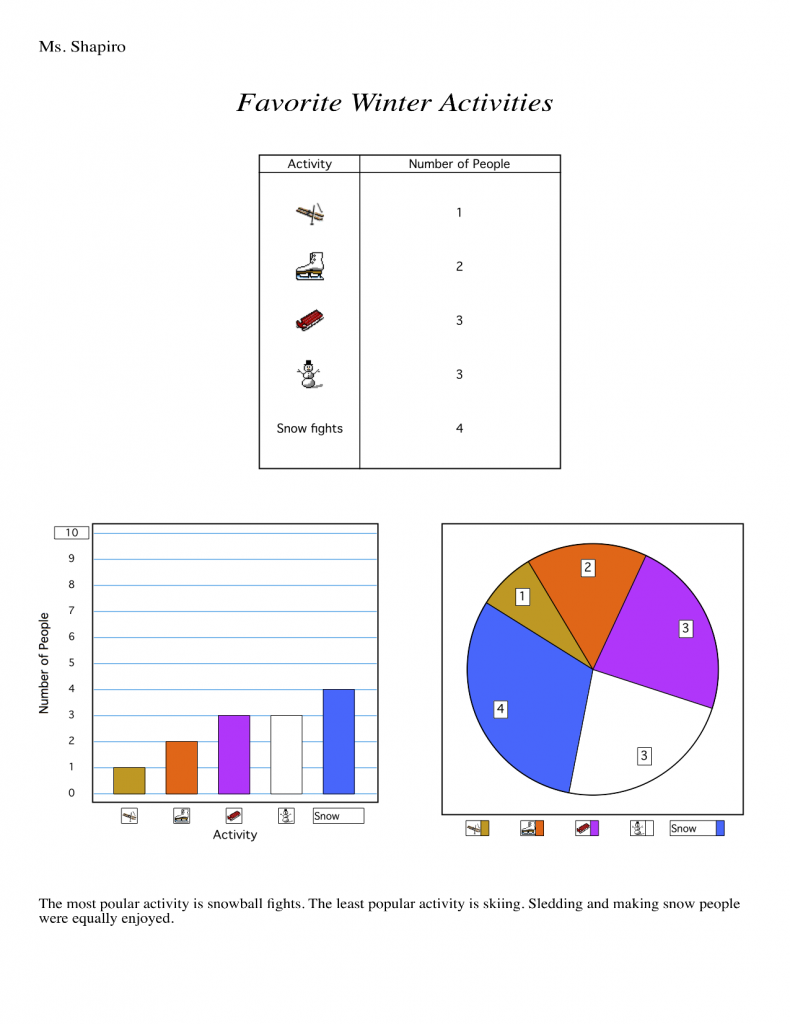
Winter Activity Graph
Graphing Food Drive Results
Fall Activity Graph
Double Bar Graphs
Graphing Survey Results
AfterSchool Snack Graph
Summer Vacation Plans Graph
Favorite Ice Cream Flavors of Room 117
Family Origin Graph
Sports Graph
Today we will use The Graph Club to create a table, bar, and circle graph of the favorite sports data that you collected in class. Be sure to add three interpretations of the graph.
UNICEF Graph
Everyday Math Reaction Time Graph
Graphing Survey Results
States Visited Graph
Snack Graph
Favorite Season Graph
We will use The Graph Club to create a table, bar graph, and circle graph of your survey results for the class’ favorite seasons. Include at least two interpretations of the graph in the notes area.
Visit these sites to learn about the four seasons.
Book Genre Graph
Favorite Candy Graph
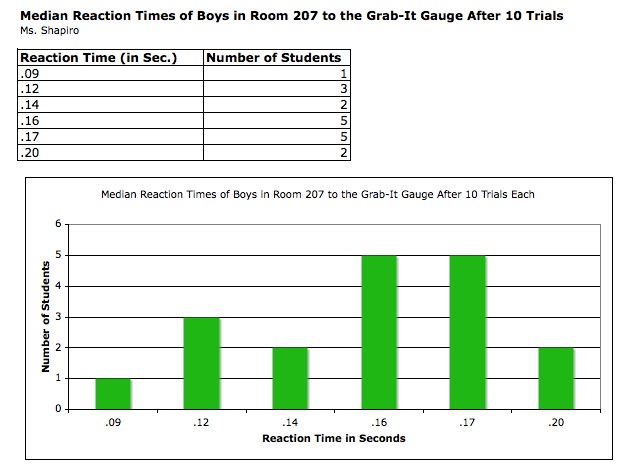
Excel Reaction Time Graph
Today you will take your Everyday Math data from the Grab-It Gauge Reaction Time experiment and put the results into an Excel worksheet. You will learn how to format the cells in the spreadsheet changing size, number type, and borders. Next create a bar graph from the data, formatting the titles, and legend. Remove the plot area of the graph and change the color of the bars.
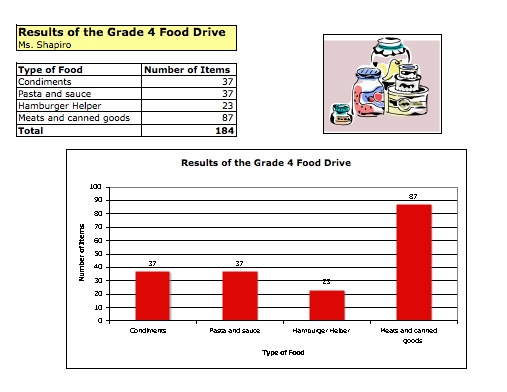
Grade 4 Food Drive Results
Today we will learn how to use Excel to graph the results of the grade 4 food drive. First we’ll learn how to set up the spreadsheet, format the cells, and then create a bar graph of the results.
After School Snack Graph
Favorite Season Graph
We will use The Graph Club to create a table, bar graph, and circle graph of your survey results for the class’ favorite seasons. Include at least two interpretations of the graph in the notes area.
Visit these sites to learn about the four seasons.
Weather Around The World
Today you will use Google Earth to travel the globe in search of weather information for the five different cities below, plus one additional city of your choice. Record the information while you are retrieving it on the Excel spreadsheet template. Use the F3 key to toggle between windows. After all the information is collected, you will learn how to create a bar graph of the temperatures of the cities.
Favorite Fruit Survey Graph
Today we will use The Graph Club to create a bar and circle graph of the class survey about favorite fruits. Add at least two interpretations of the graph in the notes section.
