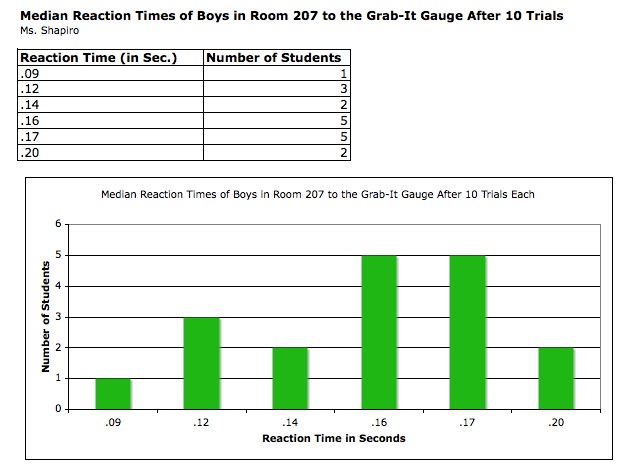
Today you will take your Everyday Math data from the Grab-It Gauge Reaction Time experiment and put the results into an Excel worksheet. You will learn how to format the cells in the spreadsheet changing size, number type, and borders. Next create a bar graph from the data, formatting the titles, and legend. Remove the plot area of the graph and change the color of the bars.
